
뭔가 내가 대단해진 것 같은 느낌!!! 그 이유는? 책의 절반을 넘겨서?! ^^
▶ 내용요약
5-1 맷플롯립 기본 요소 알아보기
- plt.figure(figsize=(x, y)) : 그래프 크기
- plt.figure(dpi=d) : DPI
. plt.figure(figsize=(x/d, y/d)) : 이처럼 계산하면 크기를 계산하면서 조절할 수 있다
- plt.rcParams[parameter] : 관련 속성값을 확인하거나 설정할 수 있음
- fig, axs = plt.subplots() : 그래프 묶음 관리. axs 를 통해 각 그래프를 지
5-2 선 그래프와 막대 그래프 그리기
- plt.plot() : 선 그래프
| plt.plot(count_by_year.index, count_by_year.values) plt.title('Books by year') plt.xlabel('year') plt.ylabel('number of books') plt.show() |
- marker='.', linestyle=':', color='red' : 꾸미기 옵션
. '*-g' : 여러 옵션을 한 방에 해치우기
- plt.xticks() : 눈금값 설정하기
| plt.plot(count_by_year, '*-g') plt.title('Books by year') plt.xlabel('year') plt.ylabel('number of books') plt.xticks( range(1947, 2030, 10) ) plt.show() |
- plt.annotate() : 값 텍스트 출력
. xytext : 출력 위치 보정
. textcoords : 상대값으로 위치 보정
| plt.plot(count_by_year, '*-g') plt.title('Books by year') plt.xlabel('year') plt.ylabel('number of books') plt.xticks( range(1947, 2030, 10) ) for idx, val in count_by_year[::5].items(): # plt.annotate(val, (idx, val), xytext=(idx+1, val+10)) plt.annotate(val, (idx, val), xytext=(2, 2), textcoords='offset points') plt.show() |
- plt.bar() : 막대 그래프
| plt.bar(count_by_subject.index, count_by_subject.values) plt.title('Books by subject') plt.xlabel('subject') plt.ylabel('number of books') plt.xticks( range(1947, 2030, 10) ) for idx, val in count_by_subject.items(): plt.annotate(val, (idx, val), xytext=(0, 2), textcoords='offset points') plt.show() |
- plt.annotate() : 값 텍스트 출력
. fontsize : 폰트 크기
. ha : 정렬
| plt.bar(count_by_subject.index, count_by_subject.values, width=0.7, color='blue' ) plt.title('Books by subject') plt.xlabel('subject') plt.ylabel('number of books') plt.xticks( range(1947, 2030, 10) ) for idx, val in count_by_subject.items(): plt.annotate(val, (idx, val), xytext=(0, 2), textcoords='offset points', fontsize=9, va='center', color='green') plt.show() |
- plt.barh() : 막대 그래프 (세로)
. height : 막대의 높
. plt.annotate(va='center') : 정렬 (세로)
| plt.barh(count_by_subject.index, count_by_subject.values, height=0.7, color='blue' ) plt.title('Books by subject') plt.xlabel('subject') plt.ylabel('number of books') plt.xticks( range(1947, 2030, 10) ) for idx, val in count_by_subject.items(): plt.annotate(val, (val, idx), xytext=(2, 0), textcoords='offset points', fontsize=8, ha='center', color='green') plt.show() |
그래프에 대한 용어 파악을 위해 캡쳐&편집 해봤다.
(이런 정성을 보여야 우수 혼공족이 될 것 같은 욕심이........ 😁)

▶ 기본 미션
p. 314의 손코딩(맷플롯립에서 bar()함수로 막대 그래프 그리기)을 코랩에서 그래프 출력하고 화면 캡처하기
코랩에서는 다른 분들도 많이 할테니, 나는 나만의 환경에서~ ^^
① 데이터 불러오기 및 컬럼 정리
- 지난 번에 '발행년도'를 int64로 만들기 위해 별의별 짓을 다 했는데 ... 간단히 끝냈다. 이런....

② 그래프 그리기
- 나는 왜 매번 이상한 결과가 나오지!? ㅠ

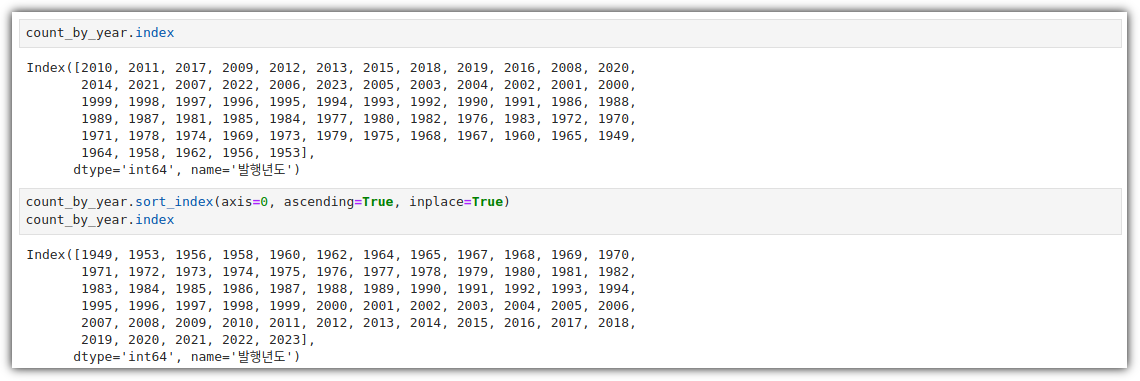
③ sort_index
- 'count_by_year' 의 index 값이 제대로 정렬이 되지 않아서 발생한 이슈이다.
- 그래서, sort_index를 해줘야 한다.
④ graph
- 이제 다시 그래프를 그려보자.

그런데, 미래에 출간된 책들은 정체가 뭘까!?
▶ 선택 미션
p. 316의 손코딩(텍스트 정렬, 막대 조절 및 색상 바꾸기)을 코랩에서 출력하고 화면 캡처하기
① 데이터 불러오기 및 컬럼 정리
- 책에 있는 내용대로 데이터를 만들었다.

② graph
- 이거... 바로 결과가 나오니 뭔가 불안하다. 뭐지 ?!

주말에 가족여행이 있어서, 조금 서둘러 공부했다 !!! 아자 !!! 아자 !!!
'Books' 카테고리의 다른 글
| [혼공머신] 1주차 - CH01. 나의 첫 머신러닝 (0) | 2024.07.07 |
|---|---|
| [혼공데분] 6주차_복잡한 데이터 표현하기 (0) | 2024.02.09 |
| [혼공데분] 4주차_데이터 요약하기 (0) | 2024.01.28 |
| [혼공데분] 3주차_데이터 정제하기 (1) | 2024.01.21 |
| [혼공데분] 2주차_데이터 수집하기 (2) | 2024.01.16 |